End-to-End Manufacturing Visibility: From Factory Floor to P&L
Effective financial planning requires more than just high-level summaries. Below is a demonstration of our deep-dive analytics framework designed for the manufacturing sector. By integrating production data with financial reporting, we provide a unified view of your business health—tracking variable costs, analyzing overhead allocation, and pinpointing the exact drivers of revenue growth across all product lines and sales channels.
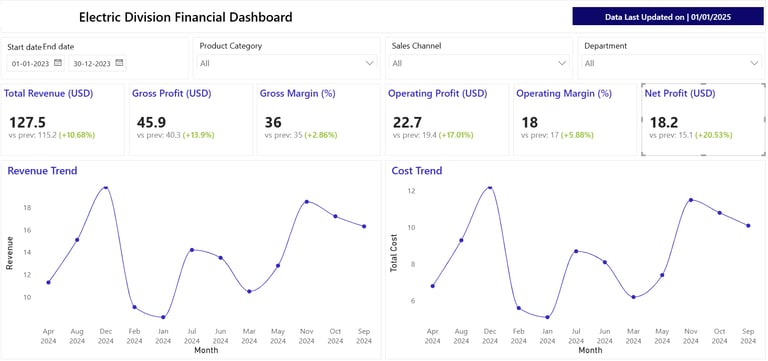
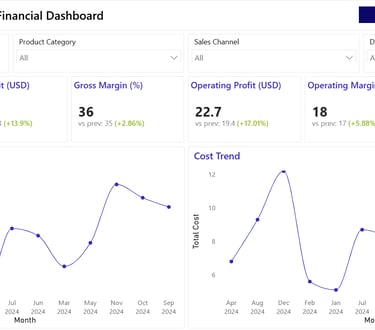
Objective: To provide an at-a-glance health check of the organization’s top-line and bottom-line performance against prior periods.
Analytical Capability: This view demonstrates high-level variance analysis. It aggregates complex transactional data into clear, actionable KPIs, allowing leadership to instantly assess whether the company is growing (Green) or contracting, and visualizes the correlation between revenue trends and cost fluctuations over the fiscal year.
Key Questions Answered:
Are we hitting our growth targets YoY?
Is our Net Profit growing at the same pace as Revenue?
What are the macro trends for Revenue vs. Total Cost month-over-month?
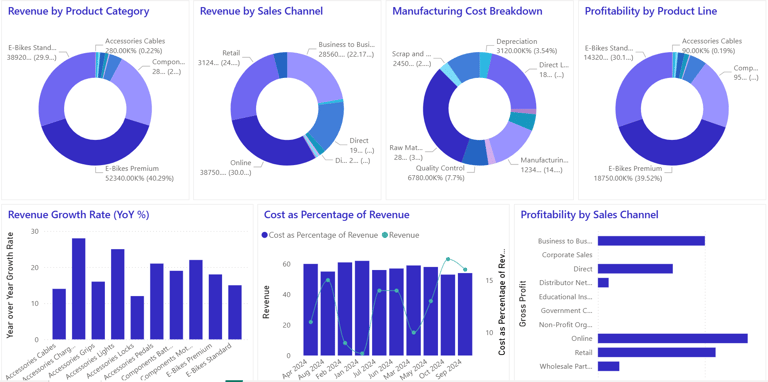
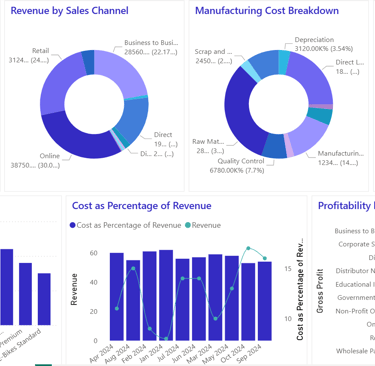
Objective: To dissect revenue streams and identify the most profitable segments across products and sales channels.
Analytical Capability: This dashboard showcases segmentation and margin analysis. By breaking down revenue by Product Category (e.g., E-Bikes vs. Accessories) and Sales Channel (e.g., Online vs. Retail), we uncover where the "quality revenue" comes from. It highlights not just volume, but profitability, helping strategists pivot resources toward high-margin areas like Online Sales and Premium E-Bikes.
Key Questions Answered:
Which product lines are driving the fastest YoY growth?
Which sales channel offers the highest Gross Profit margin?
How does the cost structure differ across product lines?
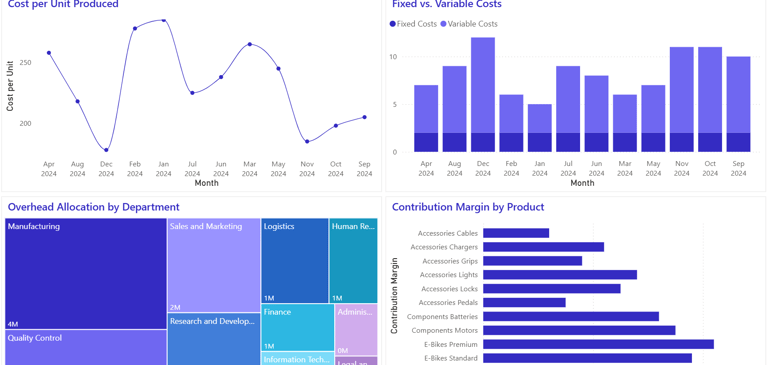
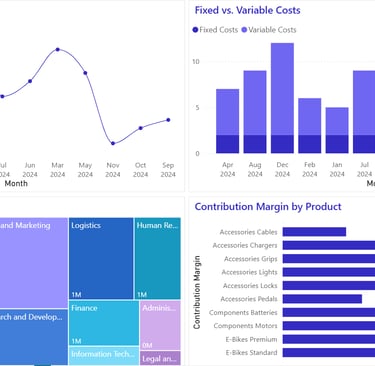
Objective: To analyze production efficiency, manage overheads, and understand unit economics.
Analytical Capability: This view demonstrates cost accounting and operational intelligence. It digs into the "Cost of Goods Sold" to separate Fixed vs. Variable costs and tracks the "Cost per Unit" over time. This level of granularity is essential for manufacturing clients to identify supply chain inefficiencies, seasonal cost spikes, or production bottlenecks that are eroding margins.
Key Questions Answered:
is the Cost per Unit stabilizing or increasing?
Which departments are consuming the most overhead allocation?
Which specific products have the healthiest Contribution Margin after variable costs?
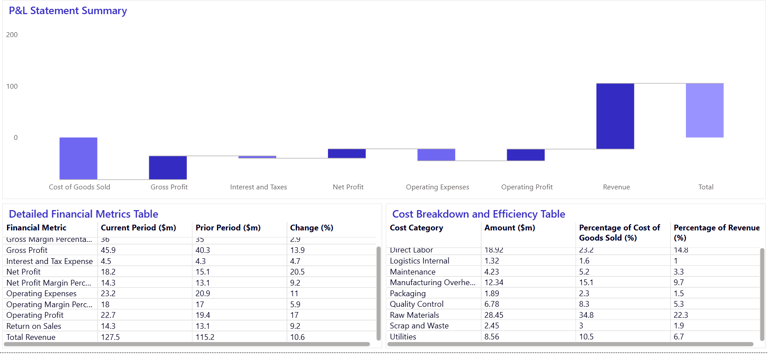
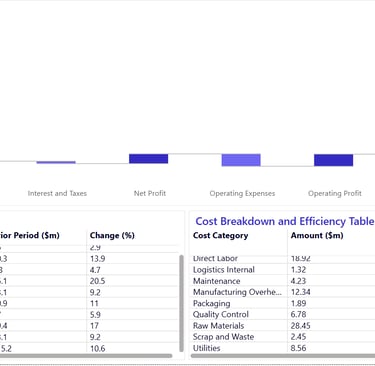
Objective: To explain the journey from Revenue to Net Profit through a detailed statement analysis.
Analytical Capability: This dashboard focuses on financial transparency and variance explanation. Using a waterfall chart, it visualizes exactly how costs (COGS, Taxes, Operating Expenses) reduce topline revenue. The accompanying detailed tables offer a forensic view of line items (like Direct Labor, Raw Materials, and Depreciation), allowing finance teams to pinpoint exactly which expense lines are deviating from the budget or prior year.
Key Questions Answered:
What are the primary drivers reducing our Gross Profit to Net Profit?
How have specific expense line items (e.g., Maintenance, Packaging) changed YoY?
What is the efficiency ratio of our Labor and Raw Materials relative to Revenue?